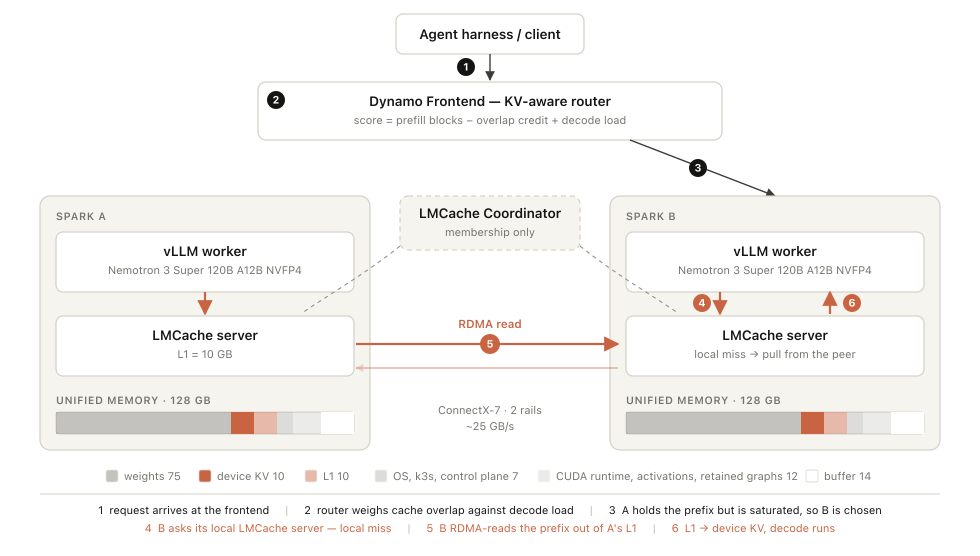
Goodput Optimization for Agent Coding with LMCache on 2x DGX Spark
I have two DGX Sparks and wanted to find the practical limit for agentic coding inference on them.
The target workload is coding-agent traffic: long prompts, many repeated prefixes, tool calls, search, subagents, occasional output bursts, and compaction cycles that rewrite the working set.
The goal was simple: get as much useful token throughput as possible from two boxes while keeping first-token latency reasonable, and decide whether there is a defensible reason to add a third box.
Decode is the bottleneck on GB10 for inference. Batching and concurrent agent users are the practical way to raise goodput, because one user decoding alone leaves a lot of the machine underused. Prefill looks fast in tokens per second, but with 64k to 128k prompts it can still take tens of seconds or minutes. If cache reuse can reduce that prefill to nearly zero, the whole coding loop feels different.
I had also been experimenting with multiple models and smart routing: send easy requests to smaller models, reserve the bigger model for complex prompts, and use cache-aware routing so locality does not fight load balance. This project was the lower-level question underneath that: how far can the cache and router be pushed on two Sparks?
The conclusion:
- Power and clock limits were required for stable long runs.
- Observability was not optional, design did not work as expected.
- Dynamo on K3s made the two-node serving topology manageable.
- vLLM’s device prefix cache is still the most valuable cache tier.
- LMCache P2P over ConnectX-7 is useful for Nano.
- Super needs a different strategy: local disk L2 can work, but L1 must be used as staging, not as a tiny retention cache.
- Shared remote L2 through Mooncake is the next step.
This is the story of getting there.
Table Of Contents
- Agentic Coding Is Mostly Prefill You Already Paid For
- Check The Input To Output Ratio
- Baseline: Disaggregation Is The Wrong First Move
- The Cache Hierarchy
- Why Observability Was Not Optional
- Power And Clock Stability
- Why Nemotron
- Memory Math: Nano
- Memory Math: Super
- Super Local L2: What Went Wrong First
- Super Local L2: The Better Hypothesis
- Results So Far
- Why Concurrency 10 Was The Knee
- Why MTP Was Not In The Runs
- Two Diagrams
- Reproducibility
- What I Learned
- Next Steps
1. Agentic Coding Is Mostly Prefill You Already Paid For
A main coding agent carries a large system prompt, repository context, tool definitions, recent messages, search output, and file reads. Subagents carry subsets of the same context. Tool calls add large chunks of new text. Search and file reads create bursts. When the context fills, compaction replaces history with a summary and the cycle begins again.
That produces a very specific trace shape:
- high input-to-output ratio
- long prompts
- mostly small outputs
- occasional large generation bursts
- repeated prefixes across turns
- branchy reuse from subagents
- compaction events that resets the prefix
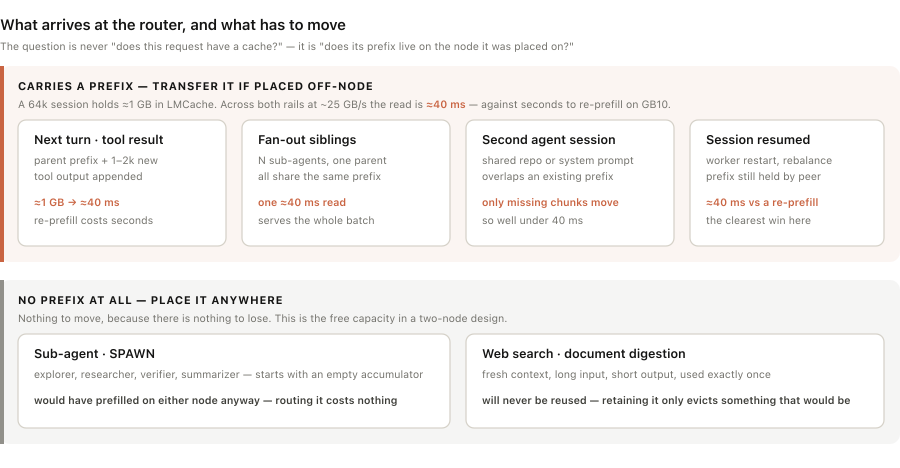
This matters because caching is not a nice-to-have optimization. It is the difference between recomputing a 128k token prompt in minutes and continuing in milliseconds from a cached prefix that was computed minutes ago.
2. AIPerf and SemiAnalsysis dataset
AIPerf is the replay harness. It reads a recorded workload, sends requests to an OpenAI-compatible endpoint, keeps a fixed concurrency, and records latency, throughput, token counts, and server-reported cache reads.
The benchmark uses a local cc-weka-s85-128k subset derived from
cc-traces-weka-062126, a session-grouped SemiAnalysis Claude
Code capture prepared for AIPerf’s weka_trace loader. I chose the Weka Traces because it
preserves the properties that matter for cache experiments: session boundaries,
turn ordering, subagent branches, prompt growth, compaction shape, model
mapping, and the prefix-reuse ceiling. A flattened request list can make later
turns run before the turns they depend on have written KV. The Weka loader keeps
the agent structure intact.
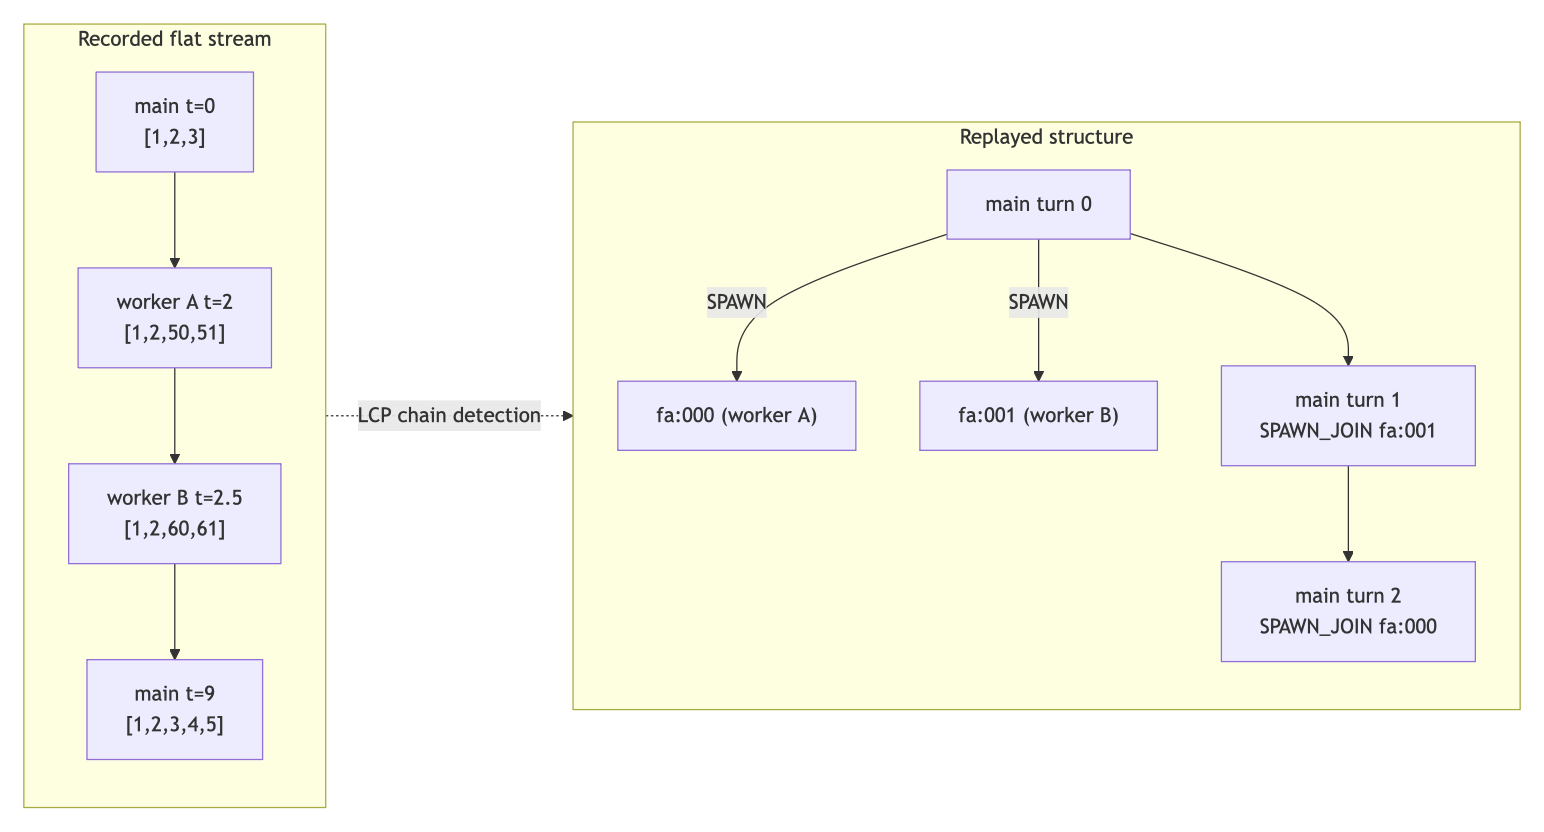
Source: AIPerf Weka trace tutorial.
The 128k context window was not arbitrary. I chose it as the balance point between a context window large enough to make KV reuse matter and a context window small enough to avoid the extra memory pressure, stability work, and run-time complications of even larger contexts. The subset tool selected whole sessions whose every request fit that limit. That is the important part: no request was truncated, and no session was partially included. The cost is that longer-context turns are excluded, which likely understates the value of KV reuse rather than overstating it.
The s85 subset was chosen because it is every Weka session that fit the 128k
limit. Smaller subsets were less useful: s24 fit entirely inside the pair’s
caches and would mostly measure a warm-cache happy path, while s40 was only
thinly oversubscribed. s85 produced about 3,485 requests, about 2.5M output
tokens, and a working set around 13.6M tokens, roughly 2.4x the pair’s device
and L1 token capacity. Because the subset is “all sessions that fit” rather
than a random sample, reruns do not change cache locality just because a
different seed picked different sessions.
For the 3,485-request Weka replay, the theoretical maximum cache hit rate was about 94.3% at the block level. The measured server-side cache-read numbers should be read against that ceiling, not against 100%.
3. Check The Input To Output Ratio
The quickest sanity check for whether a benchmark is agent-shaped is input-to-output ratio. The vLLM team has reported Codex/SWE-bench Pro around 131:1. The Weka Claude Code capture used here is around 89:1. That is the right shape for a cache benchmark: a mechanism that removes prefill is most visible when the workload is dominated by input tokens rather than generated output.
Replay also makes every cache look different from production. AIPerf replays
recorded outputs instead of the model’s own generated text, so the model does
not create exactly the same future prefix it would create live. The Weka runs
also used --ignore-trace-delays, which compresses human idle time. That keeps
the benchmark practical, but it changes residency pressure: less idle aging,
more back-to-back burst pressure. A replay as a controlled stress test,
not a perfect copy of a human coding day.
4. Baseline: Disaggregation Is The Wrong First Move
The obvious two-node design is disaggregated serving: one machine prefills, the other decodes, and KV moves between them. On this hardware, that loses on arithmetic.
Nemotron 3 Super prefills around 1,700 tokens/s in a single-stream cold-prefill measurement and decodes around 16 tokens/s per user. A dedicated prefill machine can feed decode far faster than decode can drain it. The decode phase is clearly the bottleneck, so optimizing away repeated prefill is more useful than dedicating one of two machines to prefill only. A datacenter setup would optimize with different GPUs for each phase and adapted machine count for each phase.
This also frames the value of KV reuse. Super can spend more absolute seconds in prefill than Nano, especially on 64k to 128k prompts, but its decode is so much slower that prefill is a smaller share of total request wall time. In the router-only Weka runs, prefill accounted for about 8.2% of Super’s measured wall time versus about 23.9% for Nano. That is why 3 points of additional cache read bought Nano 6.9% more requests/hour, while the same cache-read movement on Super would be expected to buy less throughput unless it also reduces queueing or TTFT tail. KV reuse is worth the most when repeated prefill is a large share of the time the system is actually spending per request.
5. The Cache Hierarchy
The serving stack has several cache layers:
vLLM device KV cache
  fastest, smallest, most token-efficient

LMCache L1
  host/unified memory, used for retention or staging

LMCache P2P
  peer L1 lookup/fetch over NIXL

LMCache L2
  persistent backend: local fs_native NVMe, Mooncake, etc.
The distinction matters. LMCache P2P over NIXL
can serve chunks from a peer’s LMCache L1. It does not make a peer’s local fs_native
disk L2 storage available.
NIXL (NVIDIA Inference Transfer Library) is an open-source, high-performance data movement library designed to speed up point-to-point communication—such as KV cache transfers—across different tiers of GPU memory and storage during distributed AI inference workloads.
The block every user shares is also the one that needs the least sharing. The common system prompt and tool definitions are loaded on both workers quickly and become locally resident. Cross-node sharing pays on session-specific prefixes: the long branch of a coding session, a subagent path, or a post-compaction continuation that lands on the other node.
The LMCache MP coordinator documents several relevant L2 adapters:
- RESP Redis/Valkey
- S3-compatible object storage, including MinIO
- Mooncake Store
- NIXL store backends
- local filesystem backends such as
fs_native
That makes shared L2 the next architectural step. The Mooncake backend is especially interesting because it is designed for distributed KV-cache storage and supports RDMA.
6. Why Observability Was Not Optional
Most wrong conclusions in this project looked plausible, a familiar outcome these days.
Examples:
- RDMA device files were mounted, but the device cgroup still blocked access. UCX could silently fall back to TCP unless RDMA counters were checked.
- RDMA could be working and still use only one ConnectX-7 rail. Dual rail had to be made explicit in the RDMA shared-device resources and UCX environment, then proven with per-rail counters.
- LMCache could successfully write to L2 while L2 reads still failed.
The required observability stack ended up being:
- node exporter for CPU, memory, disk, and benchmark run labels written through the node-exporter textfile collector
- cAdvisor for container metrics
- DCGM exporter for GPU metrics
- vLLM metrics for request state, prompt/cache tokens, queueing, and KV usage
- LMCache metrics for L1, L2, P2P, lookup, store, prefetch, and failures
- Grafana dashboards for system overview and LMCache L2
- Benchmark report from AIPerf as counter check
Without those counters the Super local-L2 result looked like “disk L2 stored KV but did not help.” With them, the cause was visible: L2 stores completed, but the L2 read path had low lookup-hit rate and massive L1 allocation failures. That is the difference between guessing and tuning.
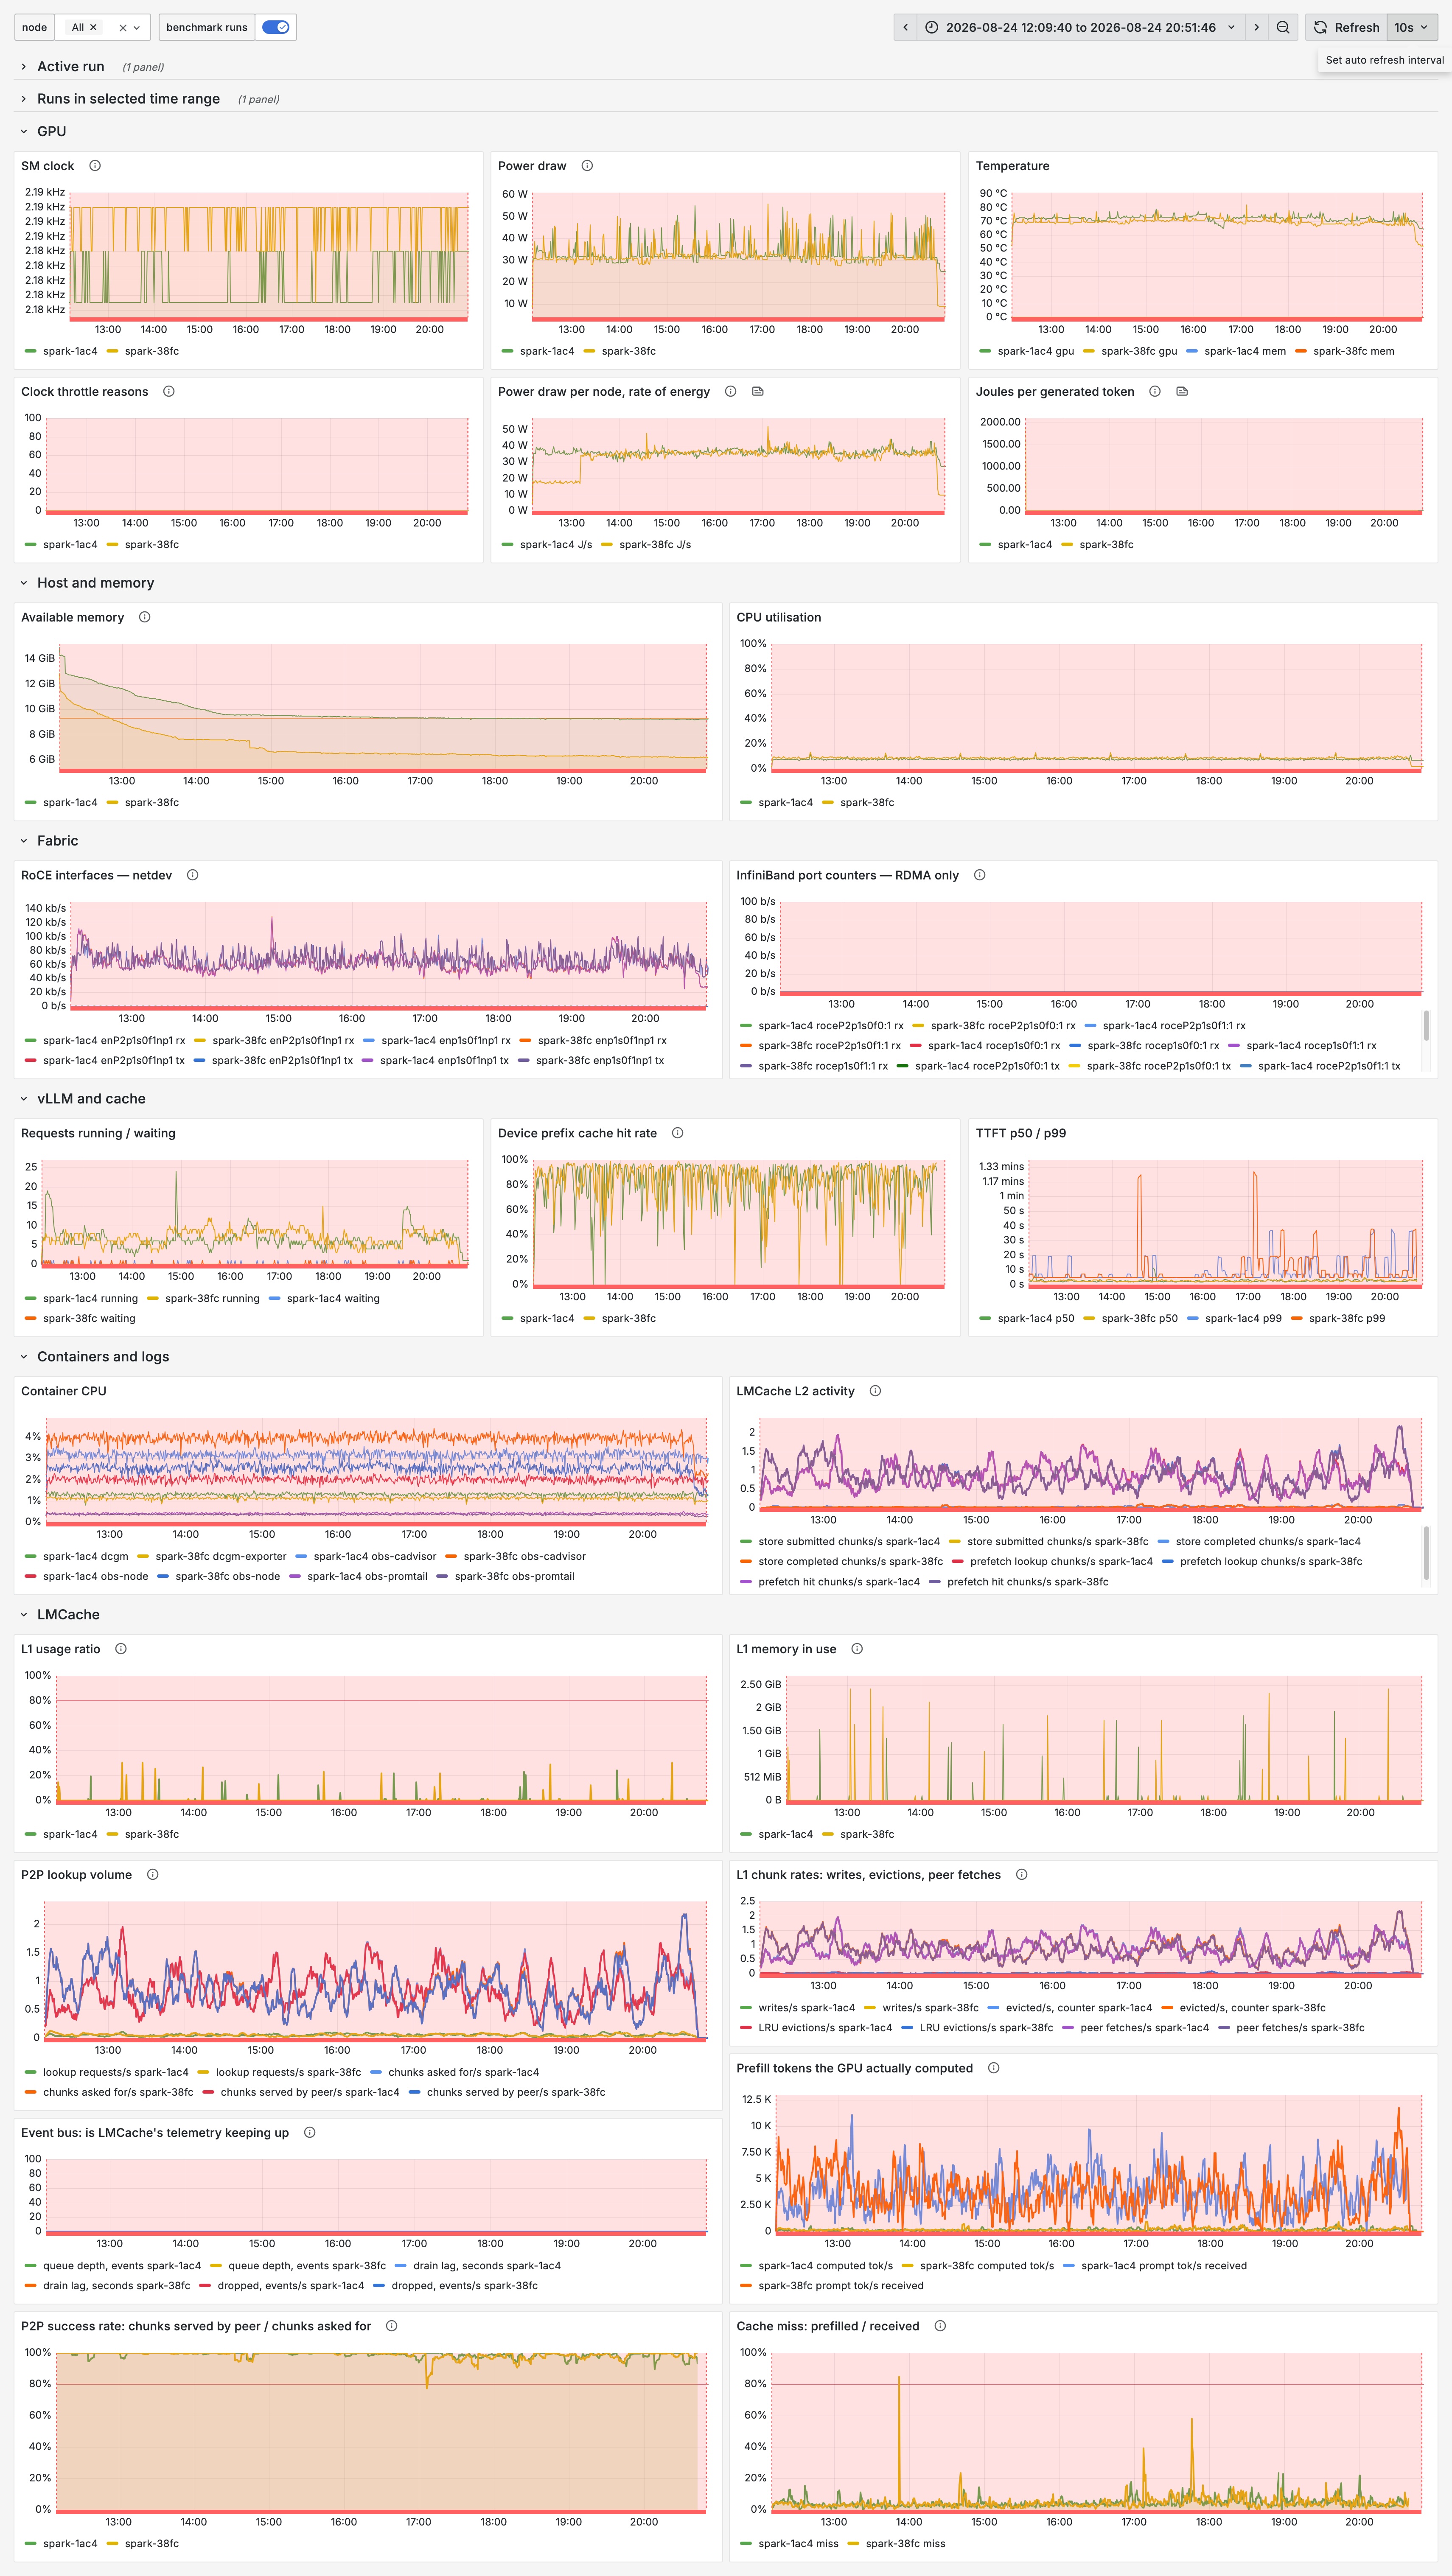
Dashboard for the run with Nemotron 3 Super and 400 GB L2 cache.
7. Power And Clock Stability
The long runs lasted 11 to 16 hours. Power clock restriction became part of the system design. Without stable clocks and power, goodput comparisons blur together: one run is testing cache behavior, the next is testing thermal or power variance.
DGX Spark can enter a bad USB-PD/power negotiation state where the GPU sits in
P0 but the clock is capped around 513 MHz and power draw stays far too low.
That failure mode looks like an inference or cache regression unless clocks and
power are on the dashboard. I shared an investigation in the NVIDIA developer forum back in January, and the member parallelArchitect shared a solution.
For the cost and efficiency story, DGX Spark is also unusual. In my runs the GPU-side telemetry was far lower: idle around 4 W, and GPU power during tests stayed below roughly 50 W. That is not full system power. CPU, memory, NVMe, fans, and ConnectX-7 consume power too.
The point is not that DGX Spark wins every performance comparison. The point is that its power and acquisition cost change what “efficient enough to run continuously” looks like. It is a difference if your power bill goes up by $35 per month versus $200 for workstation with GPUs.
8. Why Nemotron
I used Nemotron 3 Nano and Super for three reasons.
First, quality. Nemotron 3 Super is a 120B total, 12B active Mixture-of-Experts hybrid Mamba-Transformer model, and NVIDIA reports higher or comparable accuracy to GPT-OSS-120B and Qwen3.5-122B across a range of benchmarks, with material throughput advantages in long-output settings. Second, provenance: NVIDIA publishes model cards, technical reports, quantization notes, and runtime benchmarks, which makes the model family easier to reason about than an opaque checkpoint. Third, memory. The hybrid Mamba design cuts device KV memory versus pure attention, and NVFP4 makes the weights small enough for local deployment on GB10-class hardware.
That memory advantage has a catch. On device, Mamba state is stored efficiently as sequence state. In LMCache, the serialized cache has to represent resumable state at chunk boundaries so another process or node can restore computation without replaying the recurrence. For these models, the result is that LMCache stores far more bytes per token than vLLM’s device KV cache.
9. Memory Math: Nano
Nano was the first useful target for LMCache P2P, as it was smaller and therefore allowed for faster iterations.
LMCache stores about 4.25x more bytes per token than the device KV cache. That ratio makes L1 sizing harder on 128 GB. A host-memory tier that looks large in GB can still hold fewer useful tokens than a smaller device arena.
LMCache stores KV in chunks because lookup, store, prefetch, and transfer need a bounded object size. A chunk is the cache unit: if a prompt prefix matches the first N chunks, those chunks can be reused. If the prompt diverges inside a chunk, the remainder of that chunk is lost as a reusable prefix. That tail loss is small with 512-token blocks and more visible with Nano’s 2,128-token chunks.
vLLM device KV = 3,492
LMCache serialized KV = 14,848

LMCache chunk = 2,128 tokens
Chunk bytes = 2,128 * 14,848 ~= 31.6 MB

131,072 / 2,128 ~= 62 chunks
Serialized LMCache KV = 62 * 31.6 MB ~= 1.96 GB
The raw dual-rail ConnectX-7 fabric sustained 199.6 Gb/s over 60 seconds in
ib_write_bw, split almost perfectly across both rails at about 99.8 Gb/s
each. That is the fabric ceiling, not the LMCache application path. The best
LMCache/NIXL KV transfer measured 14.82 GB/s on a 1.90 GB payload, so it
proved dual-rail use but did not saturate the full fabric. At the same payload,
single-rail LMCache RDMA measured 10.23 GB/s. At Nano’s prefill speed, fetching
a cached prefix over the fabric was roughly two orders of magnitude cheaper than
recomputing it.
At the measured LMCache/NIXL dual-rail rate, a full Nano 128k prefix is about 1.96 GB and transfers in roughly 130 ms versus ~16.8 secs over 1 GbE.
That is the core Nano result: P2P only makes sense when the fabric is fast enough. Over 1 GbE the mechanism nearly cancels itself out as prefill would take a similar time.
10. Memory Math: Super
Super is the harder and more interesting case. On a 128 GB shared-memory system, Nemotron 3 Super leaves little room for cache.
vLLM device KV = 5,549
LMCache serialized KV = 24,576

LMCache chunk = 4,224 tokens
Chunk bytes = 4,224 * 24,576 = 103,809,024 bytes ~= 104 MB

131,072 / 4,224 ~= 31 chunks
Serialized LMCache KV = 31 * 104 MB ~= 3.2 GB
This is where Super is extreme: a 12 GB LMCache L1 holds about 0.49M serialized tokens, while the same 12 GB spent on the vLLM device arena holds about 2.16M tokens. The cache tier below the device cache is barely larger in useful tokens unless it can spill to disk or a remote backend, and it cannot be made much larger on a 128 GB unified-memory box without starving the model runtime.
Estimates for the working set:
10 concurrent total * 131,072 ~= 1.31M active tokens total

32 active total * 131,072 ~= 4.19M active tokens total

400 GB local disk L2 / 24,576 B/token ~= 16.3M LMCache tokens per node
That is all very tight in memory, disk space relaxed it.
| Budget | vLLM KV tokens | 131k in vLLM | LMCache L1 tokens | 131k in L1 |
|---|---|---|---|---|
| 4 GB | ~0.72M | ~5.5 | ~163k | ~1.2 |
| 8 GB | ~1.44M | ~11.0 | ~326k | ~2.5 |
| 12 GB | ~2.16M | ~16.5 | ~488k | ~3.7 |
| 16 GB | ~2.88M | ~22.0 | ~651k | ~5.0 |
| 20 GB | ~3.60M | ~27.5 | ~814k | ~6.2 |
11. Super Local L2: What Went Wrong First
The initial Super local-L2 idea for thekv16/l14 run:
KV_CACHE_MEMORY_BYTES=16000000000
L1_SIZE_GB=4
MAX_NUM_SEQS=32
L2_ADAPTER_MODE=fs_native
L2_MAX_GB=400
P2P_ENABLED=0
It completed, but underperformed the router-only baseline:
| Run | Device KV | L1 | max seqs | L2 | Cache read | TTFT p50/p90 | Output tok/s |
|---|---|---|---|---|---|---|---|
super-a-router | 20 GB | none | 32 | none | 84.08% | 3.18s / 20.17s | 65.23 |
kv16/l14 local L2 | 16 GB | 4 GB | 32 | 400 GB local | 79.14% | 35.09s / 128.48s | 57.6 |
At first this looked contradictory. If KV lands in L2, why is cache read lower?
Insights from the metrics:
- L2 store submitted and completed tracked. Chunks were not lost on write.
- L2 lookup hit rate was low, around 3.8% on one node and 6.1% on the other.
- L1 allocation failures were huge.
- L2 prefetch failures matched L1 allocation pressure.
The design flaw was using L1 as both a tiny retention cache and the staging area for L2 reads/writes.
With 4 GB L1, Super had room for only about 38 chunks, barely more than one 128k request. L2 prefetch needs L1 space to materialize chunks before vLLM can retrieve them. If L1 allocation fails, a chunk can exist in L2 and still not be used.
Disk was not the bottleneck. A synthetic store-path benchmark showed GPU/device-to-L1 and L1-to-disk L2 around 5.3 GB/s in LMCache histograms. The bottleneck was cache hierarchy design.
12. Super Local L2: The Better Hypothesis
The current Super L2 hypothesis is:
Use vLLM device KV as the real fast cache.
Use LMCache L1 as staging, not retention.
Use local NVMe L2 as the larger persistent cache.
Throttle L2 prefetch concurrency enough to avoid L1 allocation failure.
The test configuration:
KV_CACHE_MEMORY_BYTES=12000000000
L1_SIZE_GB=8
L2_STORE_POLICY=skip_l1
EVICTION_POLICY=noop
L2_PREFETCH_POLICY=default
L2_PREFETCH_MAX_IN_FLIGHT=2
L2_ADAPTER_MODE=fs_native
L2_MAX_GB=400
P2P_ENABLED=0
skip_l1 means chunks are written through L1 to L2 and removed from L1 after
store. noop disables normal L1 eviction policy behavior. Together they make
L1 behave like a staging buffer rather than a retention cache.
L2_PREFETCH_POLICY=default has a second non-obvious behavior: a fetched prefix
is used once and then thrown away from L1 after the reader finishes. The
retain policy keeps prefetched keys in L1. For Super local-disk L2, default
is intentional because L1 is staging space.
L2_PREFETCH_MAX_IN_FLIGHT=2 does not limit a 128k session to two chunks. It
limits concurrent prefetches. A 31-chunk prefix can still be fetched in waves,
but transient L1 pressure is lower:
default 8 in flight ~= 8 * 104 MB = 832 MB
2 in flight ~= 2 * 104 MB = 208 MB
The full run validated the hypothesis. The local L2 arm completed the same Weka replay in 31,326.8 seconds, with 3,484 successful requests out of 3,485 records. One request failed because the rendered prompt exceeded the 131,072-token model limit. Server-reported cache read reached 95.78%, requests/hour rose to 400.37, and TTFT p90 fell to 4.19s.
There is one measurement caveat: AIPerf’s trace-level theoretical prefix-cache model reported 94.29%, while server-reported cache read reported 95.78%. Those are not the same counter or denominator. The safe statement is that both counters say the local L2 configuration reached near-ceiling reuse.
12. Results So Far
Completed and useful runs:
| Run | Model | Configuration | Cache read | Requests/hour | Output tok/s | TTFT p50/p90 | Status |
|---|---|---|---|---|---|---|---|
weka-a-router | Nano | router/device cache only | 88.96% | 1111.53 | 229.53 | 0.99s / 5.03s | complete |
weka-b-l1only | Nano | LMCache L1 only | 89.09% | 1115.06 | 230.58 | 1.00s / 5.05s | complete |
weka-c-p2p | Nano | LMCache P2P over fabric | 92.00% | 1188.22 | 244.08 | 1.03s / 3.50s | complete |
super-a-router | Super | router/device cache only | 84.08% | 316.15 | 65.23 | 3.18s / 20.17s | complete |
super-c-p2p | Super | LMCache P2P, 10 GB device, 10 GB L1 | 78.39% | 292.69 | 60.61 | 3.29s / 33.85s | complete |
kv16/l14 local L2 | Super | 16 GB device, 4 GB L1, 400 GB L2 | 79.14% | 275.70 | 57.60 | 35.09s / 128.48s | complete |
kv12/l18 skip_l1/noop | Super | 12 GB device, 8 GB L1, 400 GB L2 | 95.78% | 400.37 | 82.35 | 2.51s / 4.19s | complete |
Three repeats of weka-c-p2p measured a 0.27-point cache-read floor, 0.4% throughput floor, and
7.0% TTFT-p90 floor. Differences smaller than that are not resolvable in this
setup.
| Run | Role | Cache read | Duration |
|---|---|---|---|
weka-c-p2p | C arm and first noise-floor sample | 92.00% | 10,555.56s |
weka-c-rep1 | second noise-floor sample | 91.73% | 10,596.02s |
weka-c-rep2 | third noise-floor sample | 91.86% | 10,670.92s |
Nano arm A equals arm B. weka-a-router read 88.96% and weka-b-l1only read
89.09%, a 0.13-point difference against the 0.27-point floor. Throughput also
differs by less than its floor. That is the sharp Nano finding: a 48 GB
LMCache L1 over a 10 GB arena performed identically to 56 GB of arena and no
LMCache at all.
Capacity was not the constraint, locality was. Arm A held 16.04M device-cache tokens. Arm B held 5.45M tokens across device cache plus L1. They tied anyway. Everything above roughly 5M tokens was inert for this replay. P2P mattered because it reached session-specific blocks on the other node, not because local capacity was too small.
Super behaves in the opposite direction because it is below that knee. The serialized LMCache tier is much more expensive per token, and an undersized L1 can be worse than no LMCache.
The important Super comparison is now clear. Local NVMe L2 worked once L1 was
treated as staging instead of retention. Against super-a-router,
kv12/l18 skip_l1/noop improved cache read by 11.70 points, requests/hour by
26.6%, output tokens/s by 26.3%, TTFT p50 by 21%, and TTFT p90 by 79%.
That result changes the Super conclusion. The first Super P2P arm failed because it spent scarce memory on the wrong tier and used a tiny L1 as a cache. The winning Super arm spent less memory on the device arena, gave L1 enough room to stage L2 transfers, skipped L1 retention, and used the NVMe disk as the real expansion tier.
13. Why Concurrency 10 Was The Knee
Concurrency 10 was measured, not chosen by taste. The instrument was
synthetic 32,000-token prompts, 512-token outputs, three requests per slot, LMCache P2P
active, and --max-num-seqs=32 so the engine was not slot-limited.
| Concurrency | Aggregate tok/s | Per-user tok/s | TTFT p50 | TTFT p90 |
|---|---|---|---|---|
| 8 | 185.4 | 28.5 | 0.35s | 9.08s |
| 10 | 194.5 | 27.3 | 0.43s | 12.09s |
| 12 | 193.4 | 25.1 | 0.54s | 17.92s |
| 16 | 199.0 | 25.1 | 17.78s | 33.94s |
Throughput flattens after 10. Concurrency 16 buys only about 2% more aggregate throughput for a 33x worse TTFT p50. That makes 10 the useful operating point for the pair: saturated, but not yet dominated by queueing, at roughly 195 tokens/s aggregate or about 700k generated tokens/hour.
One user at concurrency 1 gets 56.5 tok/s, close to the Weka corpus p50 of 57.4 tok/s. Ten concurrent users get 27.3 tok/s each. That is the local-AI tradeoff in one line: one engineer runs near captured speed, ten engineers get lower per-user decode speed but far better machine utilization.
The reason the benchmark manifests used MAX_NUM_SEQS=32 was not to chase throughput
above the knee. It was to keep the sequence-slot ceiling out of the experiment. The
cache arms were meant to measure cache placement, prefix locality, and decode
bandwidth, they were not meant to measure what happens when vLLM refuses to admit
more sequences.
That matters because the client-side CONCURRENCY=10 is not the whole story.
AIPerf’s Weka replay can create higher effective server-side concurrency through
session/subagent scheduling, and the router can temporarily skew load away from
a perfect 5/5 split. With MAX_NUM_SEQS=32, those effects remain observable
instead of becoming a hard artificial admission cap. The Super L2 comparison
should use 32 for the same reason all comparable arms used 32: scheduler
headroom stays constant while cache behavior changes.
This is also why cache size buys the tail before it buys throughput. If the worker is decode-bound, a cache hit mostly removes the long prompt side of TTFT. Throughput moves only when enough prefill is removed to change admission, queueing, or the amount of work competing with decode.
Dynamo’s KV-aware router is the other half of this. It scores workers using cache overlap and load. The intended behavior is to send a request to the worker that already has the largest prefix, unless that worker is too busy, then the router can reroute to avoid queueing. That is the right tradeoff for normal load balancing, but it can hurt local-only L2 experiments because rerouting to the other node also means rerouting away from that node’s local disk cache.
Datacenter SLAs do not apply to local hardware. MLPerf interactive p99 TTFT targets are in the 0.5s to 1.5s range, while the local Super router-only run measured 3.18s p50 and 20.17s p90, the Super P2P row reached 33.85s p90. Those numbers are still useful for local agent coding.
14. Why MTP Was Not In The Runs
Multi-token prediction would buy more decode tokens, which is exactly where Super is bottlenecked. It was not used because the cache-focused configuration needed for these runs conflicted with the configuration needed to make MTP work in this Dynamo/vLLM/NemotronH path.
First, CUDA graphs and the MoE backend conflicted. MTP crashed on this stack
with CUDA graphs enabled. NVIDIA’s recipes work around that class of issue by
using moe_backend: triton inside the speculative config plus a stripped
compilation config. That is not a neutral switch here, because this deployment
depends on the compiled MoE path for the non-MTP baseline.
Second, MTP conflicted with the prefix-caching path that this benchmark was trying to measure. The relevant upstream history is:
- vllm-project/vllm#39809: Mamba prefix caching plus MTP speculative decoding crashed at startup for NemotronH models. This issue is now closed, but it documents the exact class of conflict.
- vllm-project/vllm#47861: a proposed correctness fix for MTP prefix caching on hybrid Mamba models. It is now closed without merge because the head repository was deleted.
- vllm-project/vllm#26201: the broader prefix-caching tracker for hybrid models. This remains open.
- vllm-project/vllm#52317:
a Model Runner V2 crash where
--enable-prefix-cachingwithout explicit--mamba-cache-modeauto-selectsalland dies at startup with speculative decode. This remains open and is directly relevant because this deployment sets--mamba-cache-mode=alignexplicitly.
So the claim is not “MTP is unstable.” The claim is narrower: MTP would be a separate decode optimization, and the configuration needed to test it cleanly was not the same configuration used to test prefix-cache routing and LMCache.
15. Reproducibility
The result is not portable unless the full stack is reproducible. The important point is that no single environment variable made the system fast, the benchmark depended on stable clocks, a predictable Kubernetes deployment, explicit cache sizing, and enough observability to reject bad interpretations.
The plan is to publish the operational guide with all files and data by end of this week.
16. What I Learned
The goal was to get everything possible out of two small boxes with a fast link.
- Stable clocks
- Dynamo on K3s
- RDMA verified by counters
- vLLM device KV sized explicitly
- LMCache L1 sized by chunk math
- LMCache L2 verified by hit/load/failure metrics
- AIPerf trace replay with the right loader
- Grafana dashboards for every layer
The most important performance lesson is now equally simple: Performance gains from KV cache reuse are enormous. Nano had enough capacity and only improved when P2P found session-specific prefixes on the other node. Super did not have enough practical device-cache capacity, and local NVMe L2 became useful only after L1 stopped pretending to be a retention cache.
17. Next Steps
The most important next step is shared remote L2.
The 400 GB local-NVMe L2 run answered the main Super question: disk-backed LMCache can recover near-ceiling KV reuse when L1 is treated as staging instead of retention. That is already enough to make Super practical on two DGX Sparks.
The remaining question is whether remote L2 can keep the same cache-read rate while giving the router more freedom and making the design scale beyond two machines. Local L2 still rewards sending a session back to the node that wrote its chunks. A shared backend such as Mooncake Store would test whether cache locality can survive rerouting, failover, uneven load, and additional workers without depending on node-local disk placement.