Building a LLM training pipeline on a DGX Spark cluster with Slurm, NCCL, LoRA
The goal of this document is to share some design decisions about building an automated training pipeline with LoRA, while playing with Slurm and NCCL to validate and automate a training cluster.
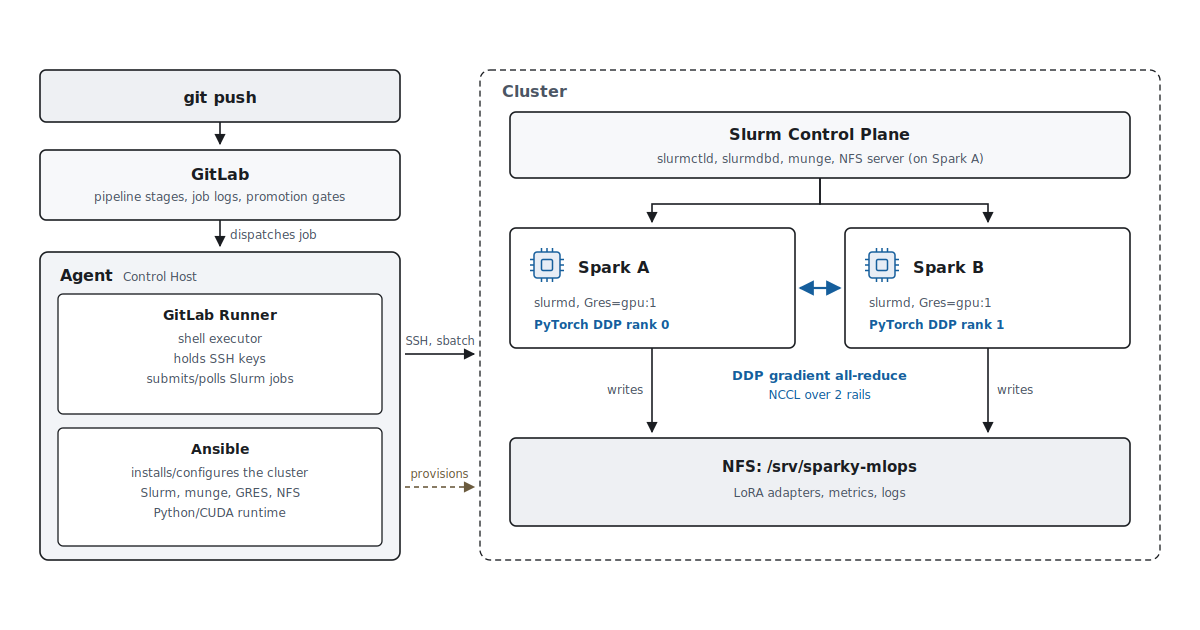
The control flow
There were still some manual steps involved as I don’t use a out-of-band tooling or any automation to set the machines up. The rest is controlled by Ansible and later by the control host with SSH tunnel into the Slurm head node.
The problem the pipeline solves
A distributed training job can fail in many ways, looks like success, but something is off. Updates can messup the configuration. Setup might ignore GPUs, firmware might be not in sync, not all rails are used for ConnectX-7, or just congestion patterns while setting the machines under load.
Every layer below exists to make one of those impossible. Every stage proofs the mechanics. The failures during the checks will help to narrow down the troubleshooting area for potential issues.
This time I did not create a Grafana dashboard to monitor the training run itself, that would be the next step. For now setup is validating all components, and no matter how many GPU computers I have, the concept scales.
Design decisions
GitLab orchestrates, Slurm executes. GitLab decides what runs and in what order. It provides audit trail and a first glimpse of what the system is doing. The Gitlab runner runs on a separate machine, basically a management node close to the cluster. Slurm decides where everything runs, scheduling for 100% utilization could be implemented with a job queue. GitLab submits through sbatch, polls for completion, then reads artifacts from shared storage. The cost is that CI has to poll rather than block, which means writing a wait loop and handling the case where a job stays pending forever.
Ansible owns machine state. It is tempting to use Ansible only for prerequisite verification. That is half the value. It installs and configures Slurm, munge, GRES definitions, NFS exports, and the CUDA and Python runtime. The cost is that Ansible becomes the only legitimate way to change a node, and any manual fix you make at 2am is a fix that disappears on the next run.
Validation in layers. Each rung proves something the one below it cannot, and each is worth running independently because each fails differently.
| Rung | What it proves |
|---|---|
| Runner smoke | CI executes on the right host. SSH tunnel to Slurm node. |
| Sync project files | Pull latest files, push to Slurm node. |
| Ansible smoke | Inventory management does its magic. |
| Slurm smoke | Scheduler places and returns exit codes, plus cluster config validation. |
| DGX Spark pre-check | Ansible does its magic inventory thing on cluster nodes. |
| NFS setup | Creating NFS share so that all nodes access the same files. |
| NCCL sweep | Running nccl-test via Slurm on all nodes. |
| HF cache warmup | Hugging Face CLI pulls model and datasets. |
| PyTorch DDP smoke | Slurm test with Distributed Data Parallel via PyTorch. |
| Real fine-tune | Jobs to train Qwen 2.5 0.5B Instruct on datasets with LoRA. |
| Evaluation gate | Inference for model with trained adapter to evaluate against expected results. |
| Review | Write summaries for human review. Decision on next tuning parameters and promotion. |
That is how the current stages look on GitLab.com:
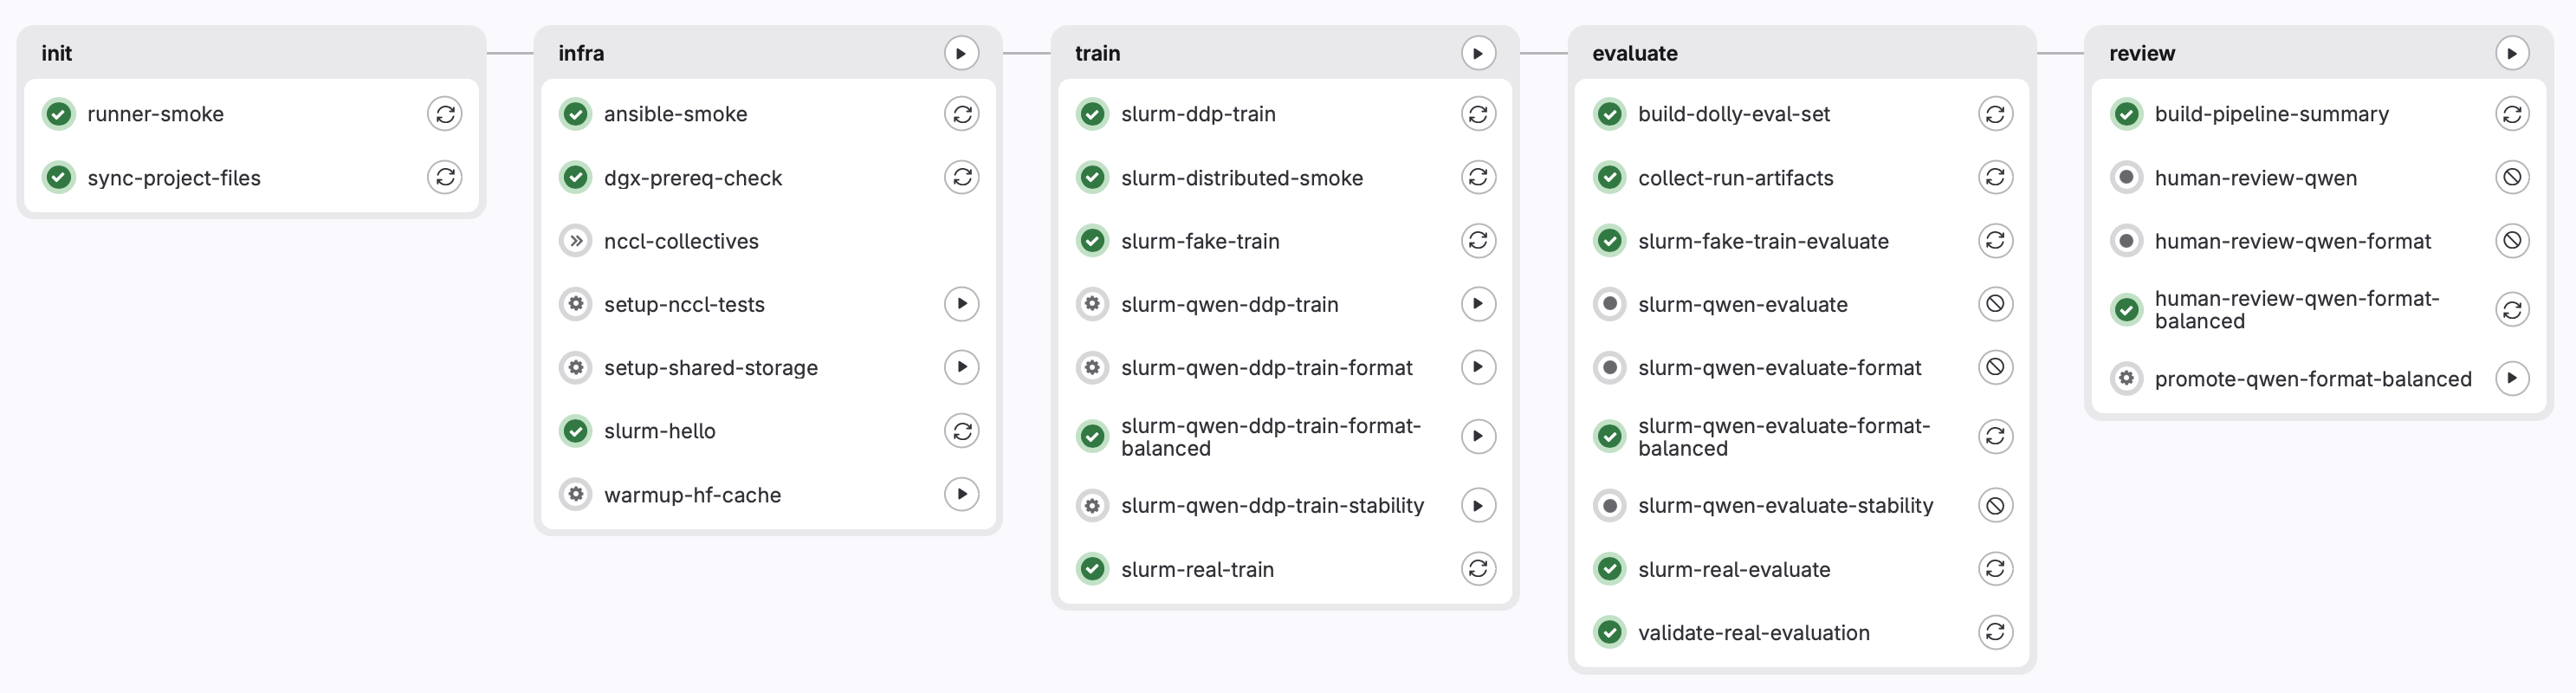
Fake training before real training. The first trainer was a Python script that slept, wrote metadata.json, and exited. It let the automation be debugged with no ML dependencies in the way. By the time real training arrived, CI was no longer a suspect.
Everything durable lives on shared storage. The share is /srv/sparky-mlops/{jobs,runs,venv,hf-cache} and Slurm is configured with #SBATCH --output=/srv/sparky-mlops/runs/%x-%j-%N.out.
%N records the writing node, so output can be attributed to a host. A dedicated CI stage syncs the repo to jobs/ on every run, which removes the possibility of a node executing a stale script.
On node-local storage that log would have been unreachable from the submitting host, and the CI job would have failed reading a file that existed.
NCCL benchmark
NCCL is the library that moves the gradients. It discovers the available transports, selects an algorithm and protocol for the message size and topology, and performs the reduction in CUDA kernels on the GPU. Compared with the classic path of copying to host memory and reducing on the CPU, host involvement is minimal: the CPU threads NCCL pins are driving network progress, not doing arithmetic.
For the current PyTorch DDP LoRA training, all_reduce_perf is the most important NCCL test. DDP mainly synchronizes gradients across ranks, and that is conceptually an all-reduce workload. In the all-reduce operation, each rank receives the reduction of input values across ranks. A rank is here one GPU. The other collectives are still useful for broader cluster validation, especially if you later test FSDP, ZeRO-style sharding, tensor parallelism, MoE, or distributed inference.
Peak bus bandwidth at 16 GiB, two ranks, one GB10 per node, NCCL 2.31.2 on CUDA 13.3:
| Collective | busbw at 16 GiB | algbw at 16 GiB |
|---|---|---|
| all_reduce | 24.18 GB/s | 24.18 GB/s |
| all_gather | 23.67 GB/s | 47.35 GB/s |
| reduce_scatter | 24.00 GB/s | 48.00 GB/s |
| alltoall | 21.74 GB/s | 43.47 GB/s |
The two bandwidth columns measure different things. algbw is buffer size divided by time. busbw corrects that for how much data actually crosses the wire, using a factor of 2(n-1)/n for all_reduce and (n-1)/n for all_gather, reduce_scatter and alltoall. At two ranks those are exactly 1.0 and 0.5, which is why all_reduce prints the same number twice while all_gather prints 47.35 against 23.67. all_reduce carries the larger factor because it makes two passes, a reduce-scatter then an all-gather, so it moves the full buffer where the others move half.
Small messages measure latency, not bandwidth. An 8 byte all_reduce takes 23.7 to 27.8 microseconds, and that floor barely moves until a quarter megabyte. Where the curve actually sits:
| Size | Time | algbw | busbw | What it shows |
|---|---|---|---|---|
| 8 B | 27.79 us | 0.00 | 0.00 | latency floor |
| 32 MiB | 1.59 ms | 21.14 | 21.14 | near DDP bucket size, 87% of peak |
| 16 GiB | 710.6 ms | 24.18 | 24.18 | plateau |
The practical consequence is that a job all-reducing modest tensors, which is exactly what LoRA does, lives on the shoulder of this curve and never sees the headline number.
A deep dive on the collectives can be found in the NCCL documentation.
Interface pinning. The job dumps ip output from both nodes before running, and between them they present more than thirty interfaces: docker0 on 172.17.0.1, a bridge on 172.18.0.1, k3s cni0 on 10.42.x, tailscale0, a wireless interface, and a long tail of veth pairs. The real fabric is two ConnectX rails on 192.168.177.0/24 and 192.168.178.0/24, with a management LAN on 192.168.1.0/24. Open MPI picked a Docker bridge on the first attempt:
export NCCL_SOCKET_IFNAME=enP7s7
export OMPI_MCA_btl_tcp_if_include=enP7s7
export NCCL_IB_HCA=rocep1s0f1,roceP2p1s0f1
Note that these do two different jobs. NCCL_SOCKET_IFNAME names the management interface used for bootstrap and out-of-band coordination. NCCL_IB_HCA names the two RoCE adapters that carry the collective itself. Confirmation that both rails are live comes from NET/IB/0 and NET/IB/1 in the NCCL log, not from the bandwidth figure, because a single-rail run at 12 to 14 GB/s still looks like a successful benchmark.
Training stack.
A LoRA fine-tune of Qwen/Qwen2.5-0.5B-Instruct on databricks/databricks-dolly-15k, one DDP rank per node, on torch 2.14.0+cu130 and Python 3.12.3. The dataset is not stock dolly. This run adds 230 rows of a format supplement, repeated ten times, which is the independent variable the run name refers to and the reason the results below move the way they do.
| Field | Value |
|---|---|
| Run | ci-2825090141-qwen-ddp-format-balanced |
| Base model | Qwen/Qwen2.5-0.5B-Instruct |
| Dataset | dolly-15k plus 230 format-supplement rows, 15,230 total |
| World size | 2, one rank per node |
| Samples per rank | 7,615 |
| Batch | 1 per rank, grad accumulation 4, global batch 8 |
| Max length | 768 |
| Learning rate | 5e-05, 5% warmup |
| LoRA | r=16, alpha=32, dropout 0.05, all 7 projections |
| Trainable params | 8,798,208 of 502,830,976 (1.75%) |
| Optimizer steps | 1,904 |
| Training time | 1766.35 s |
| Slurm elapsed | 00:30:11 |
| avg_loss | 2.0190 |
A cluster view during a two node job is a useful sanity check that the logs do not give you:
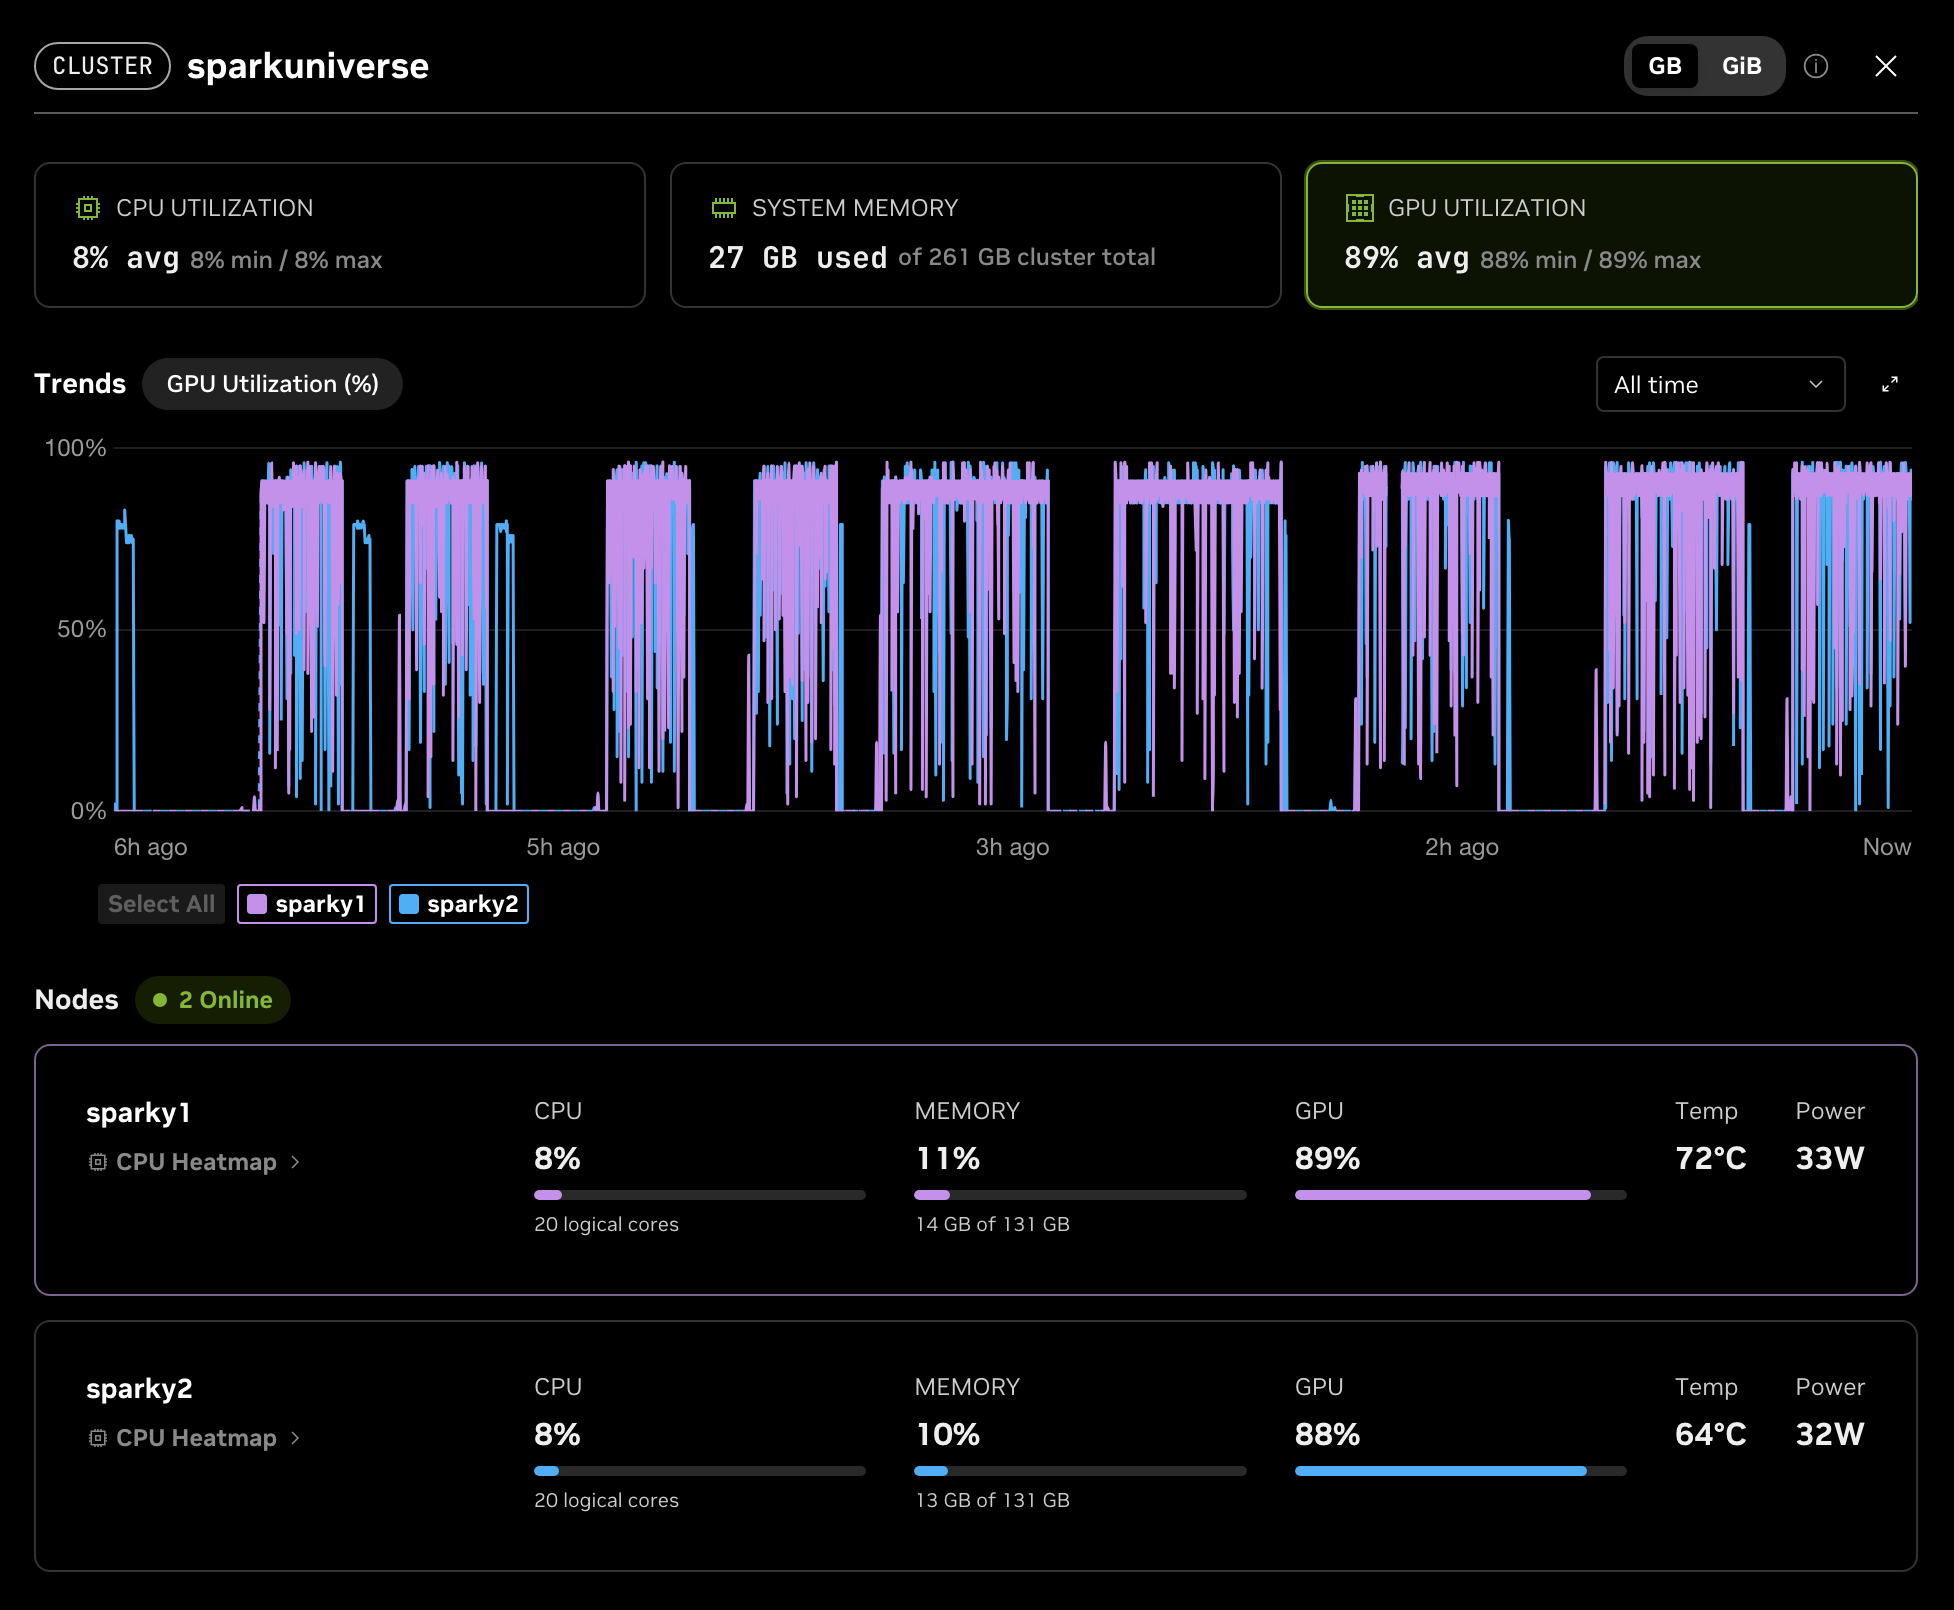
With a model this small the Sparks are bored. Memory sits at 13 GB of 131 GB per node, and the 88% GPU figure measures occupancy rather than useful arithmetic, so it flatters the workload. Finding where the GPU actually saturate with kernels is its own experiment.
The gates passed
The adapter scored 0.88 against the base model’s 0.64 across the 50 machine-scored tasks, with zero empty outputs and an average latency of 0.38 s against a 30 s ceiling. All four quality gates returned true, requires_human_review stayed true, and the run reached promote-qwen-format-balanced in the review stage. This is the first candidate this pipeline has produced that is worth promoting.
| Gate | Threshold | Actual |
|---|---|---|
| min_machine_accuracy | 0.8 | 0.88 |
| max_empty_outputs | 0 | 0 |
| max_adapter_avg_latency_seconds | 30.0 | 0.38 |
| max_accuracy_regression_vs_base | 0.03 | -0.24 |
One qualification before that number travels. All twelve gained tasks are classification. closed_qa went 9 to 9 and json_extraction went 7 to 7. The composite moved because 30 of the 50 scored tasks are classification and the adapter learned to answer with a bare label instead of a sentence. That is a formatting win, which is what this run was built to produce, and not evidence of broader capability.
Scaling ability
Some of this design extends to more nodes without change. Some of it was built for two and will break at four.
Extends cleanly. Slurm placement is already dynamic. GitLab’s submit and poll logic is node count agnostic. The artifact convention fo log files already distinguishes different nodes. Ansible playbooks apply to an inventory, so adding hosts is an inventory edit.
Breaks first, in this order:
- The shared venv. A single environment at
/srv/sparky-mlops/venvworks only because both nodes share architecture, Python ABI, and NVIDIA stack. One node of a different shape breaks every rank at import time. The fix is per-architecture environments or containers, and Kubernetes with containers are the honest long-term answer. - The NFS server. Spark A is both the controller and the only storage server. At two nodes that is fine. At eight ranks pulling model weights and writing checkpoints, one node’s disk and NIC become the bottleneck, and losing that node loses scheduling and storage together.
- The Hugging Face cache. Every rank reading
hf-cacheover NFS at job start turns model loading into a thundering herd. Pre-staging weights or a local cache per node is needed before this bites. - The single partition. One debug partition with
MaxTime=01:00:00is a lab convenience. Multiple concurrent jobs need partitions and QOS, or long jobs starve behind short ones. - Interface pinning by name.
NCCL_SOCKET_IFNAME=enP7s7assumes identical NIC naming across nodes. Heterogeneous hardware needs detection rather than a constant. - The bandwidth numbers themselves. Two-rank collectives do not predict eight-rank collectives. The busbw correction factor alone moves from 1.0 to 1.75 for
all_reducebetween two and eight ranks, and that is before ring and tree algorithms start behaving differently at larger rank counts. The sweep has to be re-run at every new size and treated as new data, not extrapolated.
Does not scale at all as designed: the control host. It is a single machine holding credentials with no failover, which is acceptable for a lab and unacceptable anywhere else.
Why cluster validation exists at all
The point of the validation ladder is not to produce a number once. It is to make sure that updates to the software stack or the configuration do not quietly move the baseline.
A driver update, a new NCCL version, a renamed interface, or a playbook change that reorders a config file can all change what the hardware delivers, and none of them announce themselves. One measurement is a benchmark. The same measurement repeated on every change is a baseline, and a baseline is what turns “the cluster feels slow” into “the plateau dropped from 24 to 13 on the commit that updated the driver”.
This is also why the sweep covers the whole range rather than one convenient size. The plateau and the latency floor fail differently. A rail dropping out shows up at 16 GiB and leaves small messages alone. A protocol misconfiguration does the reverse.
Two honest caveats. The nccl-collectives job is still manual, so today this is a baseline I can check rather than one that checks itself. And the sweep costs 3 minutes 21 seconds of cluster time, competing for the same two GPUs as training.
What comes next
Keep the GPUs busy. Two GPUs at 88 percent for nine minutes when someone happens to push code is a lab, not a cluster. Slurm already provides the mechanism, because a queue that backfills is exactly how idle time gets filled. What is missing is work to put in it: scheduled runs rather than push-triggered ones, and a queue deep enough that the hardware is not waiting on a commit.
Close the loop. The evaluate stage exists, with slurm-qwen-evaluate, slurm-real-evaluate, and validate-real-evaluation. What it lacks is teeth. human-review-qwen is a manual job, so the promotion decision is currently a person reading output and clicking a button. Replacing that needs three things this lab does not have:
- a standard list of experiment configurations, so runs are comparable rather than ad hoc
- a reward function that scores a run without a human present
- a scheduler that picks the next configuration from the last result instead of from a list written by hand
That combination is roughly what an evaluation factory means. NVIDIA has been building this shape in the open with NeMo Evaluator, which packages evaluation harnesses as pluggable benchmark environments defined in YAML and exposes a nel gate command returning GO or NO-GO across a benchmark set. At lab scale the parts worth borrowing are the standard configuration format and the gate.
Then serving, carrying the same validation. An endpoint scored with the identical prompt set that gated the artifact is the only way to catch merge bugs, tokenizer drift, and quantization surprises, because scoring an adapter on disk and scoring the thing answering HTTP are different measurements.
A closing caution, mostly to myself. A reward function I wrote is one I can optimize into nonsense without noticing, and an automated loop is a machine for being wrong faster. Automating the gate is the goal. Automating it before the thresholds have earned trust would reintroduce exactly the failure this whole design exists to prevent, which is a pipeline that reports success while proving nothing. I have done the same mistake with multi-agent systems before. I have more homework to do with figuring out the right parameters for model training.
Not everything perfect, but it runs most things automated. Sharing my repo: https://gitlab.com/christian.pappert/sparky-mlops/
Reading material
Most of these describe, at production scale, what this lab does by hand.
-
NVIDIA Mission Control, deployment summary and validation checklist End to end bring-up for GB200 and GB300 NVL72 racks: infrastructure, firmware, provisioning, high availability, Slurm install, and system performance testing. The hardware is nothing like two DGX Sparks. The shape of the checklist is the same, and it is a good list of things I had not thought to validate.
-
NVIDIA HPC Benchmarks, microbenchmarks NCCL tests, NVSHMEM, OSU MPI, and GEMM. The GEMM entry is the useful reminder here: this lab only measures the network. There is no compute-side benchmark in the pipeline, so a GPU running slow would pass every gate described above.
-
Cumulus Production Ready Automation, integration guide Ansible roles with Jinja2 templates and structured variable files, driven from GitLab CI, with NetQ validation as a pipeline stage. The same two tools this lab runs on, applied to network fabric, and the role structure is worth copying.
-
Run NCCL benchmarks with the Cluster Readiness Engine Runs all_reduce, all_gather and all_to_all with
-b 8 -e 32G -f 2 -n 100, then compares measured bus bandwidth against per-architecture thresholds to produce a pass or fail. Almost the same sweep as the one in this document, with the part this lab does not have yet: a threshold that decides instead of a number I read.